Market Update and Historical Drawdowns
- LVM Capital
- Oct 2, 2024
- 1 min read
Join Tyler and Drew as they discuss the S&P 500’s impressive year-to-date returns, driven by strong earnings growth and rising valuations. We’ll also take a look at historical drawdowns, noting that the average peak-to-trough decline is about 14% in any given year, with 25% declines occurring in 21% of years since 1928—roughly every five years. To wrap up, we offer insights on how to navigate these inevitable market fluctuations, emphasizing the importance of having a tailored stock allocation and extending your investment time horizon.
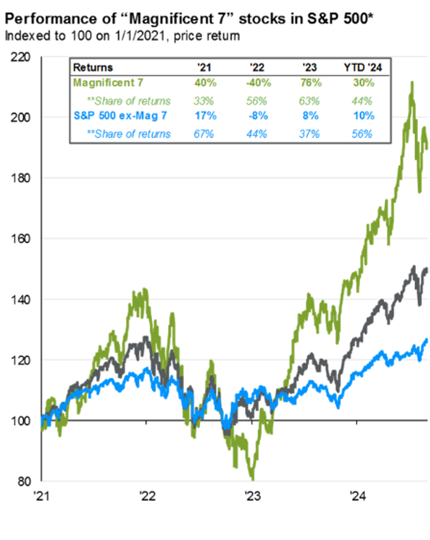
Charts reviewed in the podcast:
Source: FactSet
Source: JP Morgan
Source: FactSet
Source: Crandall Pierce


Comments